Is it possible to understand the dynamics of cryptocurrency markets over different time scales
Interested cryptocurrency users have already realized that sometimes the values graphs of cryptocurrencies look quite similar. For example, such a phenomenon has been noticed between Bitcoin, Ethereum and Litecoin and reported on StackExchange.
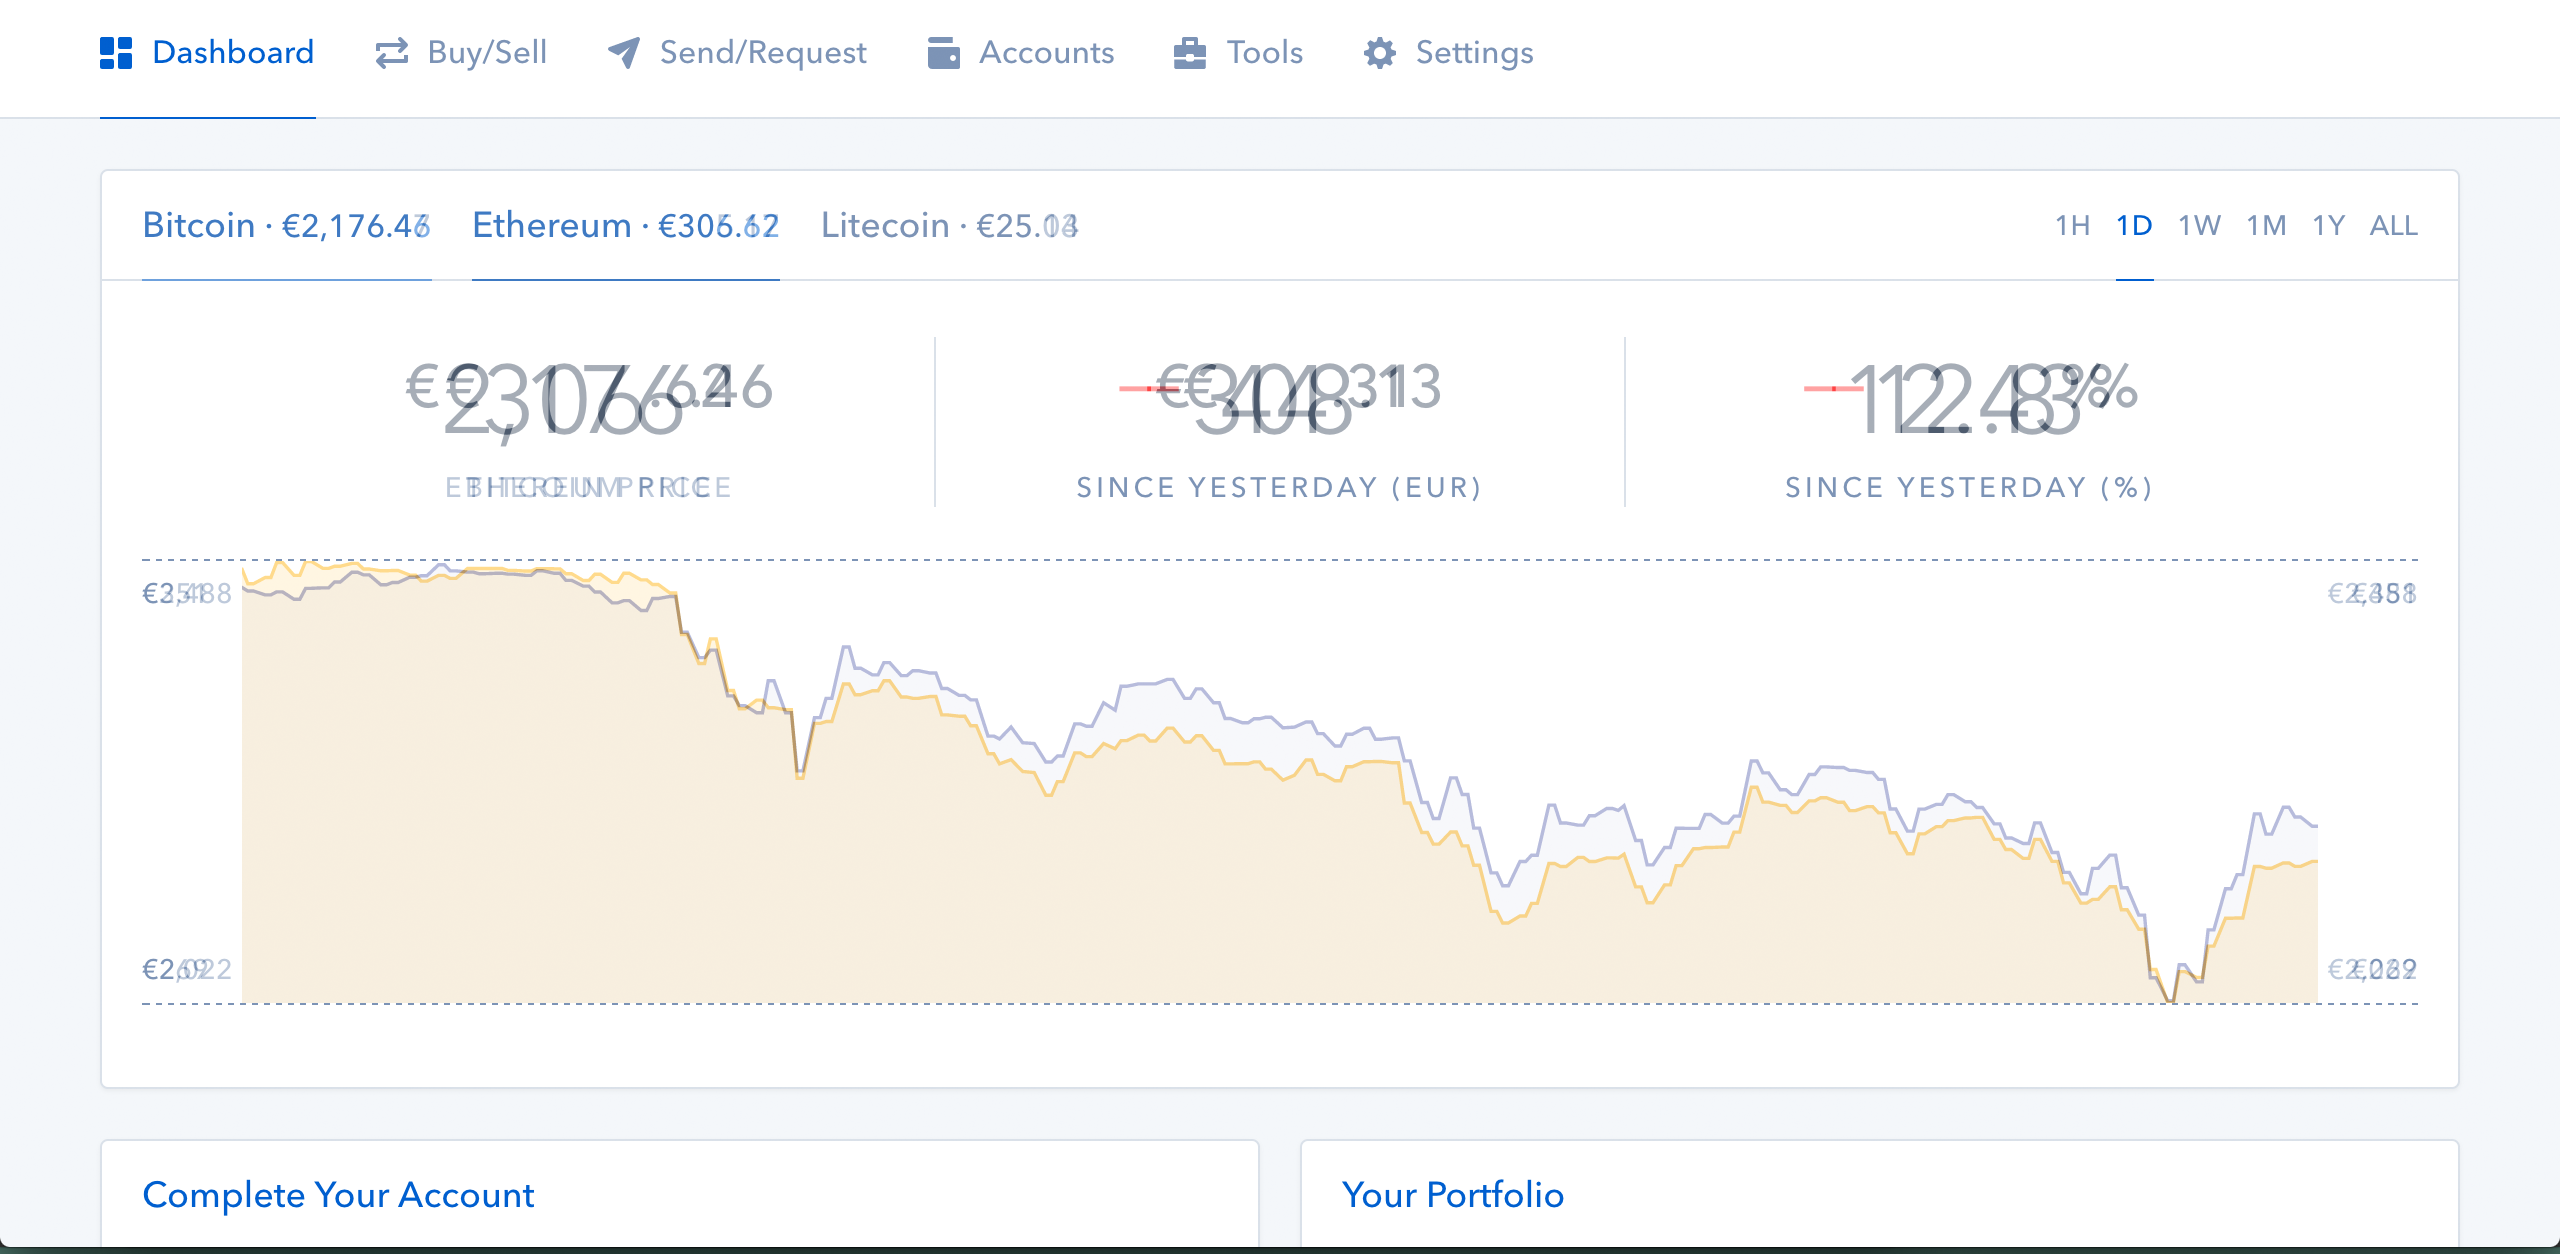 The similarity between Bitcoin, Ethereum and Litecoin
Other correlations between Ripple and Bitcoin and between other currencies have also been calculated and shown in the same forum.
In fact, similarities between different time periods for the same currency can also be seen very easily in the value graph all cryptocurrencies. The pattern of fluctuations in cryptocurrency values during an hour, roughly, the same as that for a day, a week, a month, a year or a decade. In fact, these fluctuations are plainly non-linearly scaled variations of one another. Consequently, if you are shown a typical value graph of Bitcoin over some period of time, it is really hard to tell if it’s for the last week or for the last month — the distributions of downs and ups are nearly the same regardless of the time frame. That is to say, the behaviour of the cryptocurrency market is a self-similar fractal pattern.
A self-similar fractal pattern is a repetition of itself across all time scales following a power low that can be quantified by its exponent or, equivalently its fractal dimension.
Obviously, with this knowledge we might think that we might become rich. While such knowledge surely gives a new perception into hidden regularities of cryptocurrency markets, unluckily the granularity of its predictive power is limited and does not provide specific information about the behaviour of individual transactions.
Nevertheless, it’s an important ingredient for understanding the dynamics of the cryptocurrency market over different time scales. In fact, this had been observed much before cryptocurrencies arrive and had stimulated the development of a new interdisciplinary subfield of finance called *econophysics* and motivated investment companies to hire physicists, mathematicians and computer scientists to use this sorts of ideas to develop novel investment strategies. The econophysics approach predicted several things accurately up to now, including the price of gold.
If you are planning to invest or currently investing on cryptocurrencies, no matter which currency it is, you should definitely take a look at this interesting transdisciplinary approach called econophysics.
Further Reading
Benoit Mandelbrot, The Fractal Geometry of Nature, W. H. Freeman and Company, 1982.
Rosaria N. Mantegna, H. Eugene Stanley, An Introduction to Econophysics: Correlations and Complexity in Finance, Cambridge University Press, 1999.